|
(work on the graphs- Church growth Digest
survey and Analyses pp10-12)
The Inner City.
. .
Graveyard for the Church?
by Greg Smith
Reference: Smith, G. (1998). "The Inner City...Graveyard for the Church?"
Church Growth Digest: 10-12.
The received wisdom from over a century of urban mission in Britain is that Inner urban areas are the graveyard for the church. The Faith in The City report, and all the other literature speaks of a small and declining Christian presence. However recent research for the Religious Directory of Newham, backed up by findings of two local surveys could turn this received wisdom on its head.
Newham is now officially the most deprived local authority district in Britain, and its population of
217,000
includes 42% of black and ethnic minority people, with roots in almost every part of the world. We are certainly not a secular community; like Athens it is easy to see that religion is ever present, even though for many it is 'an unknown God' who is worshipped. It is hard to make any precise estimates but it seems likely that up to 25% of the people of Newham have some level of active religious commitment and involvement in a religious organization. Perhaps another 50% have at least a basic religious belief and some level of affiliation to a religious community, even if only to the extent of calling themselves 'Church of England' or 'Hindu' when filling in forms. It is our impression that partly due
to the growth of our multi-cultural, multi-racial, multi-faith community, and partly due to a revival of interest in religion that numbers of religious people are actually growing. Within Christianity there is even some evidence of significant conversion growth even among the most resistant of local groups, the white Cockney working class.

Numbers of Religious Groups
The history of religious institutions in the borough of Newham is a rapidly changing one. Before 1850 there were the two ancient parish churches of West Ham and East Ham, a congregational chapel and not
much else.
The
second half of the 19th Century saw in West Ham alone the establishment of over 40 Church of England parishes, 5 large RC parishes, and a very strong Free Church presence with
97
Methodist, Baptist and independent
churches... as well as numerous settlements and mission halls. There was also a significant Jewish presence with a number of synagogues and cemeteries.
The post
1945 exodus/decline
in local population on top of a general
decline
in church-going habits, and the loss of a number of church buildings in the blitz, led to closures and withdrawal on the part of the denominations, the C of Emerging parishes and the Free Churches selling off buildings,
By 1975
(according to Colin Marchant) there were only
18
Anglican buildings and 20 Free Churches in West
Ham (the
western half of Newham).
However the boxed statistics for all faith communities are based on information collected for the directory (based on a response rate of 78% of all congregations, and
96.5%
for the mainline Christian churches),
Pentecostal congregations are by far the most numerous category, followed by Anglicans (CofE), independent evangelicals and Muslims. But when it comes to owning their own buildings the Anglicans are in a league of their own, although almost all Muslim, Baptist, Methodist, Salvation Army and URC groups do own their buildings. Many of the newer Pentecostals and Independent Evangelicals and some of the Roman Catholic groups are 'tabernacling'
in
rented church halls and community centres.
With
non-congregational organisations the highest numbers describe themselves as Ecumenical, Roman Catholic or CofE. Ecumenical agencies are appropriate for Christians seeking to serve the wider church, or engage
in
social action, while the high number of Roman Catholic groups is
largely accounted for by the growing presence of religious orders of priests and sisters choosing to spend their lives among the people of the inner city.
Table
1
shows their breakdown by faith/denomination which is further illustrated in Figures 1-3

Fig 1 Buildings Owned by Congregations

Fig 2 Christian Congregations by Denomination

Fig
3 Non-Christian Faith Congregations
Church Attendance
In London in 1903 the Daily News survey of religious life indicated that the attendance rates in inner and especially East London were low. In West Ham, church attendance
was put at 20% (55,649 people in 137 churches and chapels). Nonconformists accounted for 65% of the churchgoers, 32% were C of E and the Roman Catholics had grown to 12%.
The next Church censuses with any claim to comprehensive coverage were those of
1985
and
1989
conducted by MARC Europe. They showed a 10% increase over the four years in adult attenders in Newham from 6,800 to 7,500 and a growth in membership of 16% from 13,300 to 15,400. But this still only represented some 5% of the adult population. In addition some 2,100
children were counted as attenders. There are many problems about the reliability and coverage of this data (it was based on only 65 churches), but it did not seem implausible to those with local knowledge of the churches, and was matched by similar trends in other parts of inner London. My own estimates of numbers for the mid 1980s, based on extensive visiting participant observation, suggested about 2% of the population of E13/E16 (predominantly white lower class) might be regular attenders at Christian churches, while at least 7% of the population of (multiracial, more socially mixed) E7 might attend.
A recent local study by John Oliver (1992) has looked at adult Christian learning and church attendance in Canning Town and Custom House, a predominantly white council estate in the South West corner of the borough, well researched in earlier urban mission literature. He
estimated
2.86%
of the local population were churchgoers
(230
of them attending 7 local churches). Nearly three quarters of them were female and just under a quarter were black. Oliver characterizes church- going as 'deviant' behaviour in the local (white) working class Cockney culture. Yet significantly he reports growth in attendance; a doubling of estimated numbers from
150 in 8
buildings (seating 3,200) in the early 1980s to 300 in 7
buildings seating 1900 in
1991/2.
Only a
small part of the growth can be put down to active Christian incomers (mainly black people). There has been some significant 'conversion' growth.
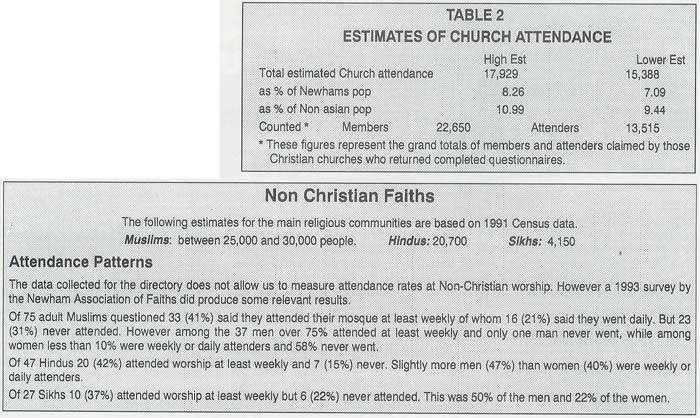
From the data we received for the directory it is possible to make some estimates of attenders at congregations in the Christian tradition (see Figure 4).
The precise question put to church
leaders was... How many people usually attend the
largest meeting/service you regularly hold
(eg for Christians this would be the main Sunday Service, for Muslims Friday prayers).
Estimates for the Christian Community are based on the following assumptions in order to allow for the cases where the information had not been received.
The high estimate ... assumes that churches with missing information have numbers equivalent to the mean average of the churches in their denomination for which we have figures.
The low estimate ... allows for the possibility that smaller less established congregations are over-represented among the missing data and also incorporates some 'local knowledge' about the likely
size of particular congregations.
Our estimate for church attendance in Newham is much higher (almost double) the MARC Europe
1989
figures. Why should this be?
Firstly we have discovered many churches who were not included in the
MARC census and then elicited
a
much higher response rate.
Secondly our question invited church leaders to estimate the number who attended regular worship, rather than insisting on an
actual count on a given Sunday. The temptation to round up numbers and to count every person who might attend would have been irresistible for many.
Thirdly there has been
a
substantial growth in religious observance among
Christian groups in Newham in recent years.
The graphs show that nearly half the reported attenders are Roman Catholics, with Pentecostals and Anglicans in next place. Yet there are relatively few Roman Catholic churches claiming an average attendance of over 600. African independent churches were next largest with an average of 120 attenders. Baptists, Anglicans, Evangelicals, and Methodists averaged about 60 to 80 attenders. URC and Moravians were smaller with about 40 attenders each and the
Salvation
Army
smallest at under 30. The
Pentecostal
churches for whom we have data
averaged
just over 60 attenders, but we have reason to belive that most of the missing data was likely to be from very small congregations, which would have considerably reduced the average attendance.

8,000
7,000
6,000
5,000
4,000
3,000
2,000
1,000
0
Fig 4:
No of Attenders by Denomination
Religion in Newham: Some Conclusions
The work for the directory and supporting evidence from the surveys suggests that Newham
in
1994
is a
very religious place and far from being the 'godless urban jungle' some would have us believe. There
has
been
a
growth in the numbers of
religious groups, in levels of attendance at worship and in the extent and intensity of religious belief. Much of this is associated with the growth of black and Asian communities in the area, and the significance of religion in their lives.
Within Christianity the major growth area has been the mushrooming of Pentecostal and African independent congregations. Almost all of these churches are black-led, and have predominantly black congregations. In the last decade the African element has predominated, and in addition many mainline white led congregations have
benefited from an influx of African Christians, and the lively faith and worship style they carry with them. But even among the white people of Newham, including the 'Cockney' working class, there is at least as much religious belief and activity as in most other parts of Britain, and some signs of a new interest in religion. However it is still the case that about 80% of local whites rarely if ever go to church, and among them the rates of attendance are lower for men, for young people and for the working class.
Why are people turning to, or at least keeping up their religion in a place like Newham? One key factor
is the importance of ethnic identity and community belonging, which is closely linked to church or mosque membership.
Poverty and deprivation, which has increased savagely in recent years may also push people towards the church, as a caring community that can offer some support, or even towards a God who will meet their material and emotional needs. The increased efforts of many faithful evangelists and church planters who have settled in the area must also playa part.
Perhaps religion locally has now achieved a critical mass, and the very ethos of Newham as a community where it is no longer deviant to be religious plays a part. Maybe, however, in such a diverse community religious commitment is at least tolerated better than it would be in a monochrome one. And finally of course there is the mysterious and encouraging work of the Holy Spirit.
THE RELIGIOUS DIRECTORY OF NEWHAM (2nd Edition
1994-95)
contains much fuller details of these statistics as well as contact information for all the groups surveyed. It is available from December 94 for a £5 cheque payable to Aston Community Involvement Unit Durning Hall Earham Grove London E79AB
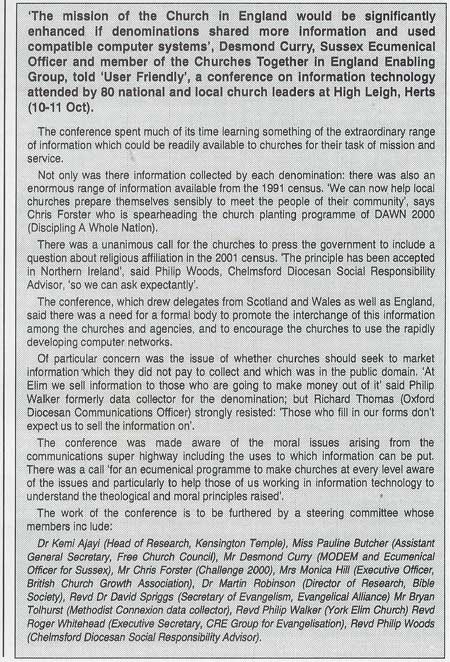
Conference Mission Enhanced by Computers
PRESS RELEASE

| ![[Company Logo Image]](../images/Bias-t1smallerfile.jpg)
